Before
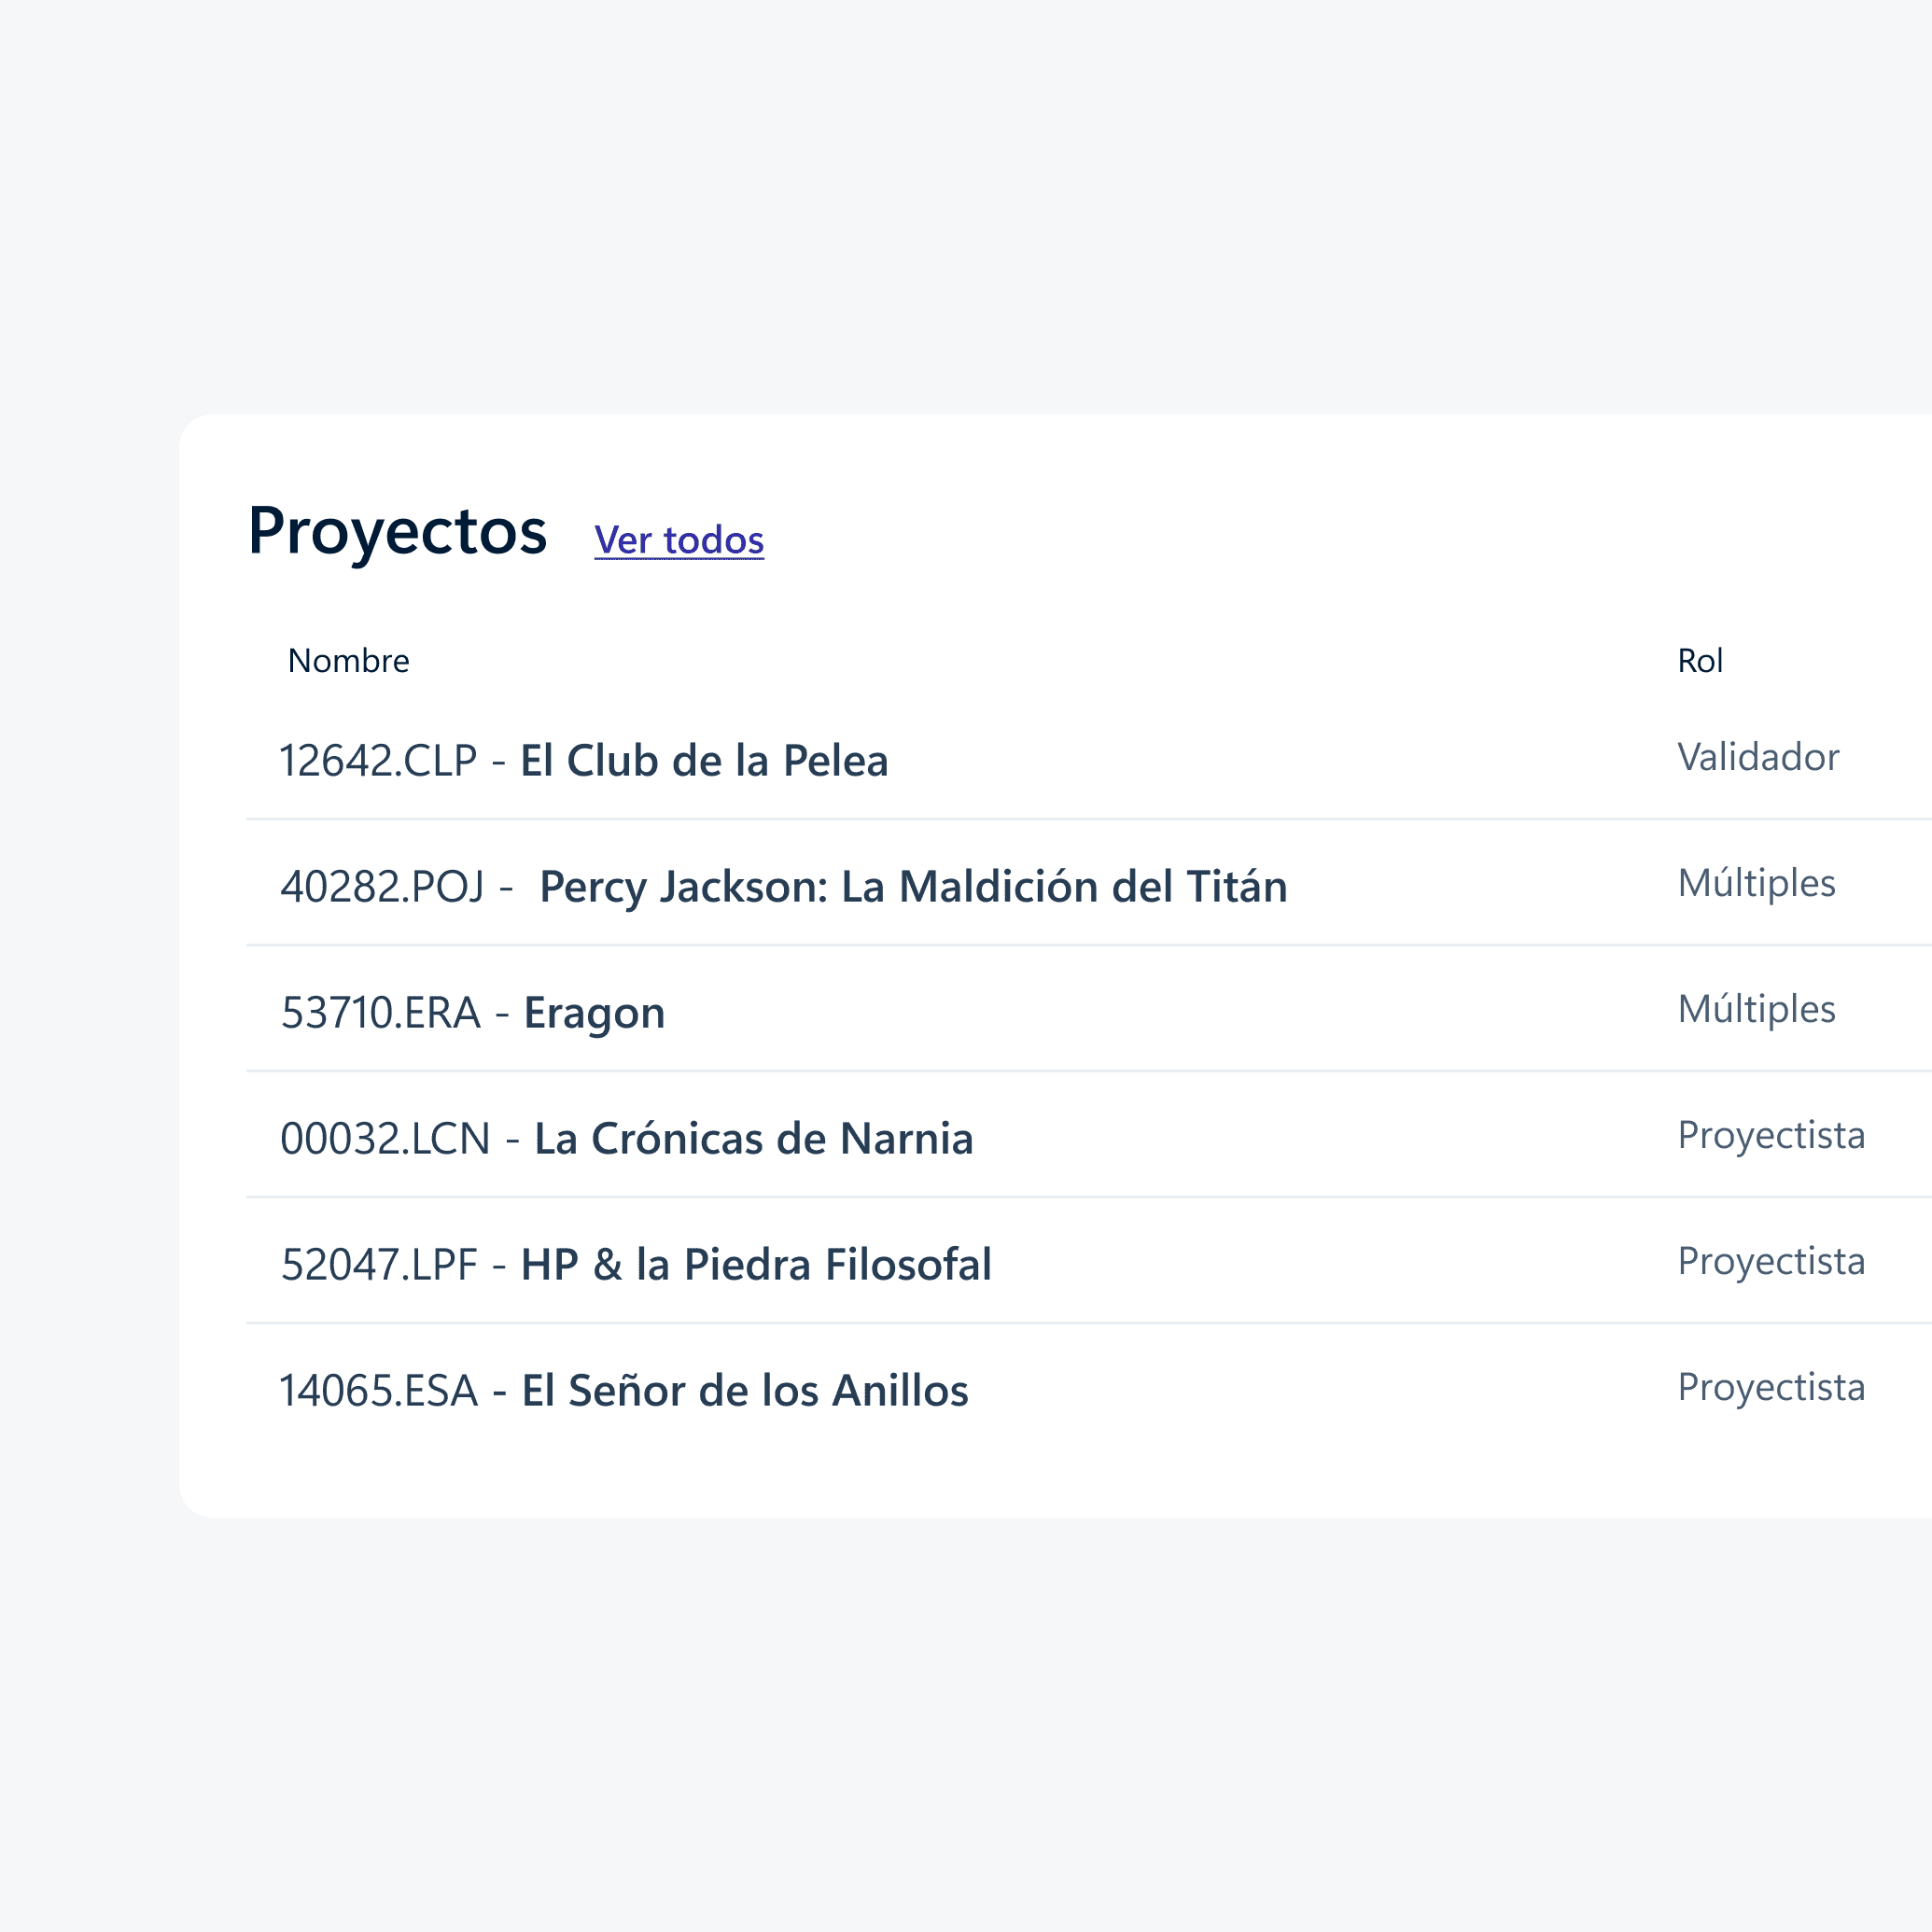
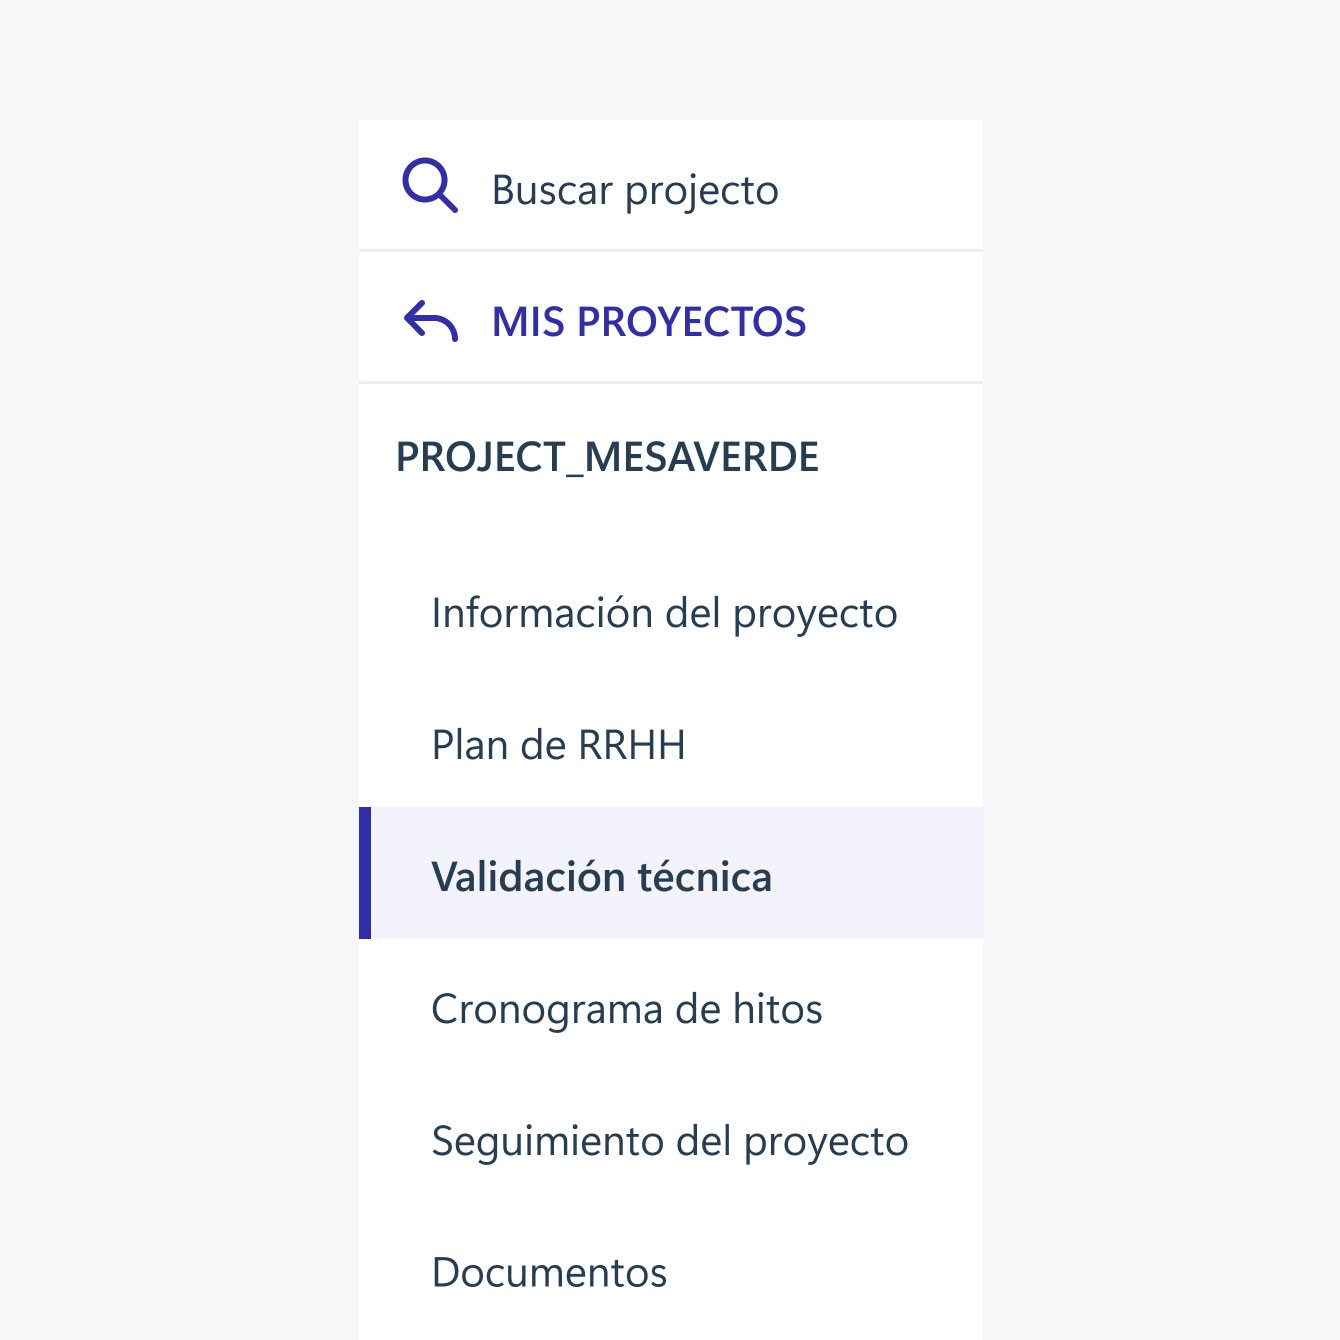
Many steps to reach a task. People only found out they had a pending task after searching for the project, opening it and finding the right specialty.
Case study
Case study
Industry
Industry
Upstream
Upstream
Upstream
Oil and gas
Oil and gas
Oil and gas
Year
Year
2019
2019
Platform
Platform
Web
Web
Every phase of an upstream project at Argentina’s largest energy company has to pass technical validation by several areas. It ran on a SharePoint site where people couldn’t tell where to act or whose turn it was, and project managers couldn’t see what was late. I led design of an internal platform that makes each project’s phase, area and status visible at a glance.
The UI shown in this case study is translated from Spanish, the app’s original language.
Led design. I ran twice-weekly working sessions with the client, designed the flows and interface, and built the interactive prototype, which let the business analyst test user scenarios and helped developers see how the whole project fit together. Delivered at IT Resources, a software consultancy.
Started in July 2019, launched in April 2020.
Live within days of its original target, despite the pandemic and lockdown, and well received from day one: good feedback on accessibility, ease of use and visual design, in both the portal and its emails. The client's project lead called it "a great achievement."
Every phase of an upstream project at Argentina’s largest energy company has to pass technical validation by several areas. It ran on a SharePoint site where people couldn’t tell where to act or whose turn it was, and project managers couldn’t see what was late. I led design of an internal platform that makes each project’s phase, area and status visible at a glance.
The UI shown in this case study is translated from Spanish, the app’s original language.
Led design. I ran twice-weekly working sessions with the client, designed the flows and interface, and built the interactive prototype, which let the business analyst test user scenarios and helped developers see how the whole project fit together. Delivered at IT Resources, a software consultancy.
Started in July 2019, launched in April 2020.
Live within days of its original target, despite the pandemic and lockdown, and well received from day one: good feedback on accessibility, ease of use and visual design, in both the portal and its emails. The client's project lead called it "a great achievement."
Every phase of an upstream project at Argentina’s largest energy company has to pass technical validation by several areas. It ran on a SharePoint site where people couldn’t tell where to act or whose turn it was, and project managers couldn’t see what was late. I led design of an internal platform that makes each project’s phase, area and status visible at a glance.
The UI shown in this case study is translated from Spanish, the app’s original language.
Led design. I ran twice-weekly working sessions with the client, designed the flows and interface, and built the interactive prototype, which let the business analyst test user scenarios and helped developers see how the whole project fit together. Delivered at IT Resources, a software consultancy.
Started in July 2019, launched in April 2020.
Live within days of its original target, despite the pandemic and lockdown, and well received from day one: good feedback on accessibility, ease of use and visual design, in both the portal and its emails. The client's project lead called it "a great achievement."


Many steps to reach a task. People only found out they had a pending task after searching for the project, opening it and finding the right specialty.
One long, crowded page. Everything on one scroll: more information than anyone needed, hard to scan, and formatted like raw HTML.
Colors with no logic. “Observation answered” is a normal step, but in red it looked urgent, as if someone had done something wrong. The colors followed no logic.


Each upstream project has different phases and sub-projects attached to it. The challenge was how to display them and make them easy to interact with.
After clicking on one of the phases, it shows below all the areas of work involved to get the approval of that phase in question (small cards).
The color of each card represents the progress of that area and the tag on it, the latest update.

A new card that brings together information that used to be spread across several screens.
HOVER TO INSPECTTAP TO INSPECT
A new card that brings together information that used to be spread across several screens.
HOVER TO INSPECTTAP TO INSPECT
I focused first on the main flow, completing a pending project’s task, as it was the most complex, for which I created wireframes to validate with them and later the rest of the secondary user flows.